Adding zero cost observability and monitoring for the entire stack using New Relic
In the new age of cloud-ready scalable applications, observability is a critical trait for getting to know what is happening with the application and also to investigate when something goes wrong. Observability is the ability or capability of a service/program to be observed or monitored for the vital stats providing detailed information on the overall operations.
There are several tools or stacks ( ELK, Graphana, Prometheus, etc ) that are used for this. The issue with all of them is the setup and maintenance required in-house. That is where services like New Relic and Datadog come in handy. They are both leading cloud-based SaaS services for application monitoring and reporting. In this post, we will see the setup for the New Relic and why I chose it for monitoring my services.
Why New Relic ?
I was trying to see the options available for monitoring my stack of microideation apps and this blog. I stumbled upon Datadog and New Relic. If you check for a direct comparison, most of the sources are considering them as neck-on-neck with each other in terms of functionality and ease of use. My reason for choosing New Relic was purely on the pricing.
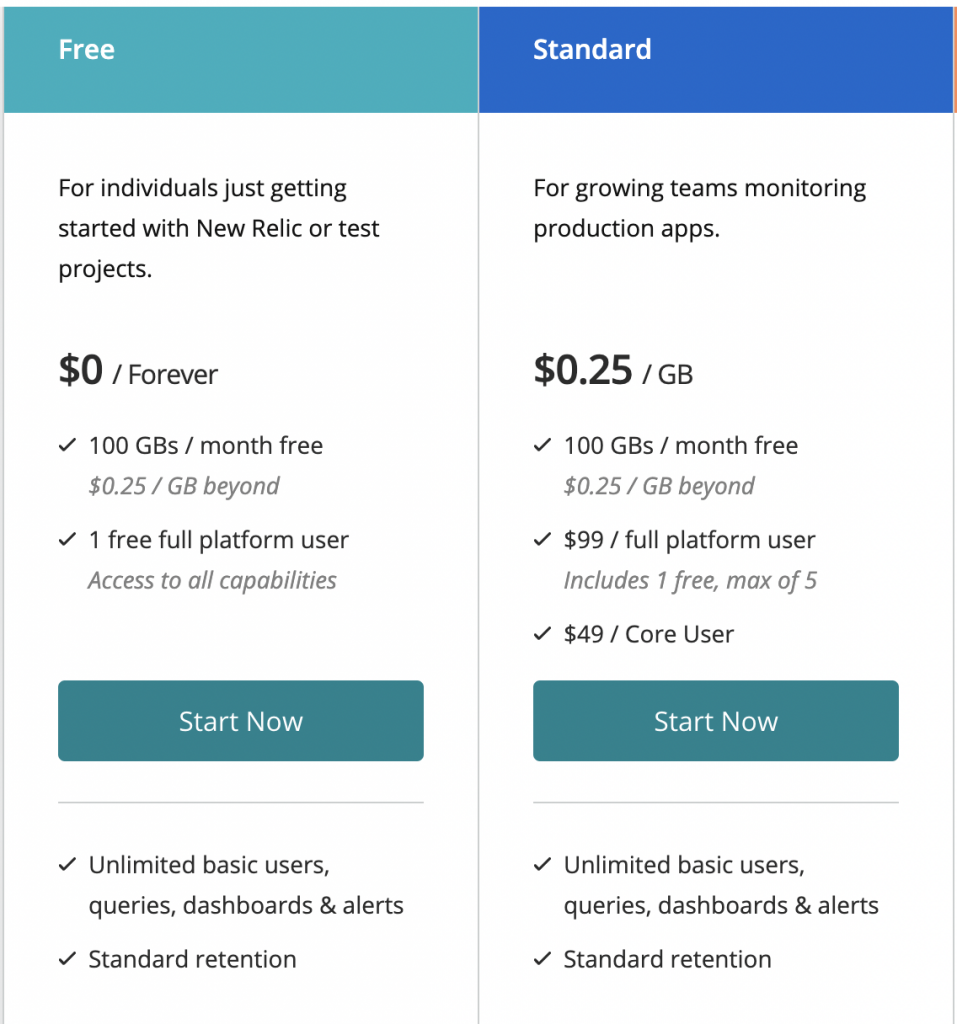
- 100GB of logs and metrics per month.
- 1 platform user with full access rights.
- No limits on hosts.
- No limits on the services that I can monitor.
- Any number of dashboard / query users who can view the dashboards created by above admin. This is handy when you are a small team with someone handling devOps and wants to give access to other devs to the dashboards only for checking.
- The only addtional pricing is 0.25 / GB additional and each extra user is $49 ( for core user with reduced access than platform user ).
- The pricing structure is complex as you need choose and subscribe to each service separately.
- Expensive compared to New Relic offering.
- Limits the number of services and hosts on the free tier.
Quick pricing comparison
Setup
Now that we have New Relic chosen, let’s see how to go about the setup of the account and connecting the services ( or hosts ) to get the metrics flowing into New Relic.
Account Creation
First of all, you need to have a New Relic account created ( preferably under your work email if you are creating for your business ). Head to https://newrelic.com/signup and provide the information. You are not required to provide any credit card information while using the free tier.
Once the account is set up, you will be taken to the “New Relic One” platform which is the unified interface for New Relic for all your services listing, APM ( Application Performance Monitoring ), and alerts. Now, we can start linking our servers and services to New Relic.
Host monitoring
Let’s start by adding some of the hosts ( servers ) to the monitoring. These could be your VM / EC2 instances running in the cloud or a server in the data center. The key is that we need to install a lightweight infra-agent for New Relic that will post the details to New Relic.
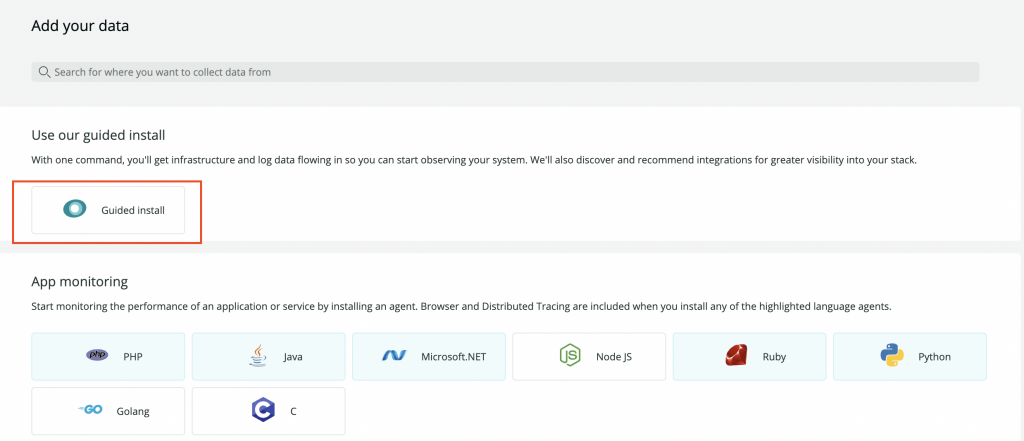
When you access the “New Relic One” platform, you will be asked to add data by linking a service/host. If not, while on the main dashboard, you can click on the “Add more data” button.

This will open the dialog for linking the service. You need to click on the “Guided Install” for installing the host agent ( core infra agent for New Relic ).
Choose the environment. Based on what you choose, New Relic will provide the standard installation script for that environment along with your account details which you can just execute on your server. In my case, I am running Linux servers on GCP.
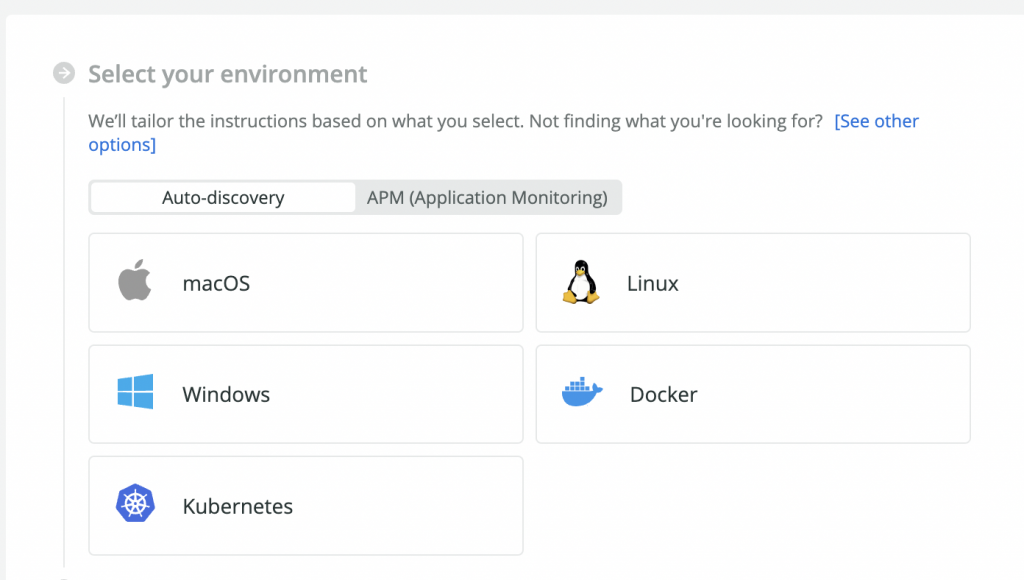
Click on the “Begin Installation”
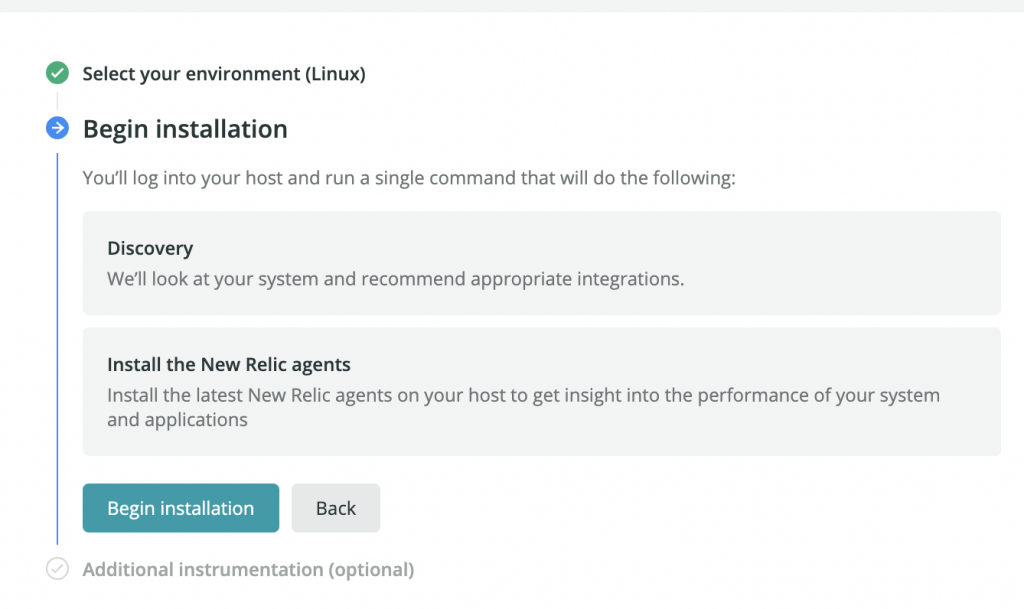
This will present you with the command to be executed for getting the new relic agent installed. If you don’t have a direct outside connection, you may also customize the command to include a proxy for the internet connectivity.
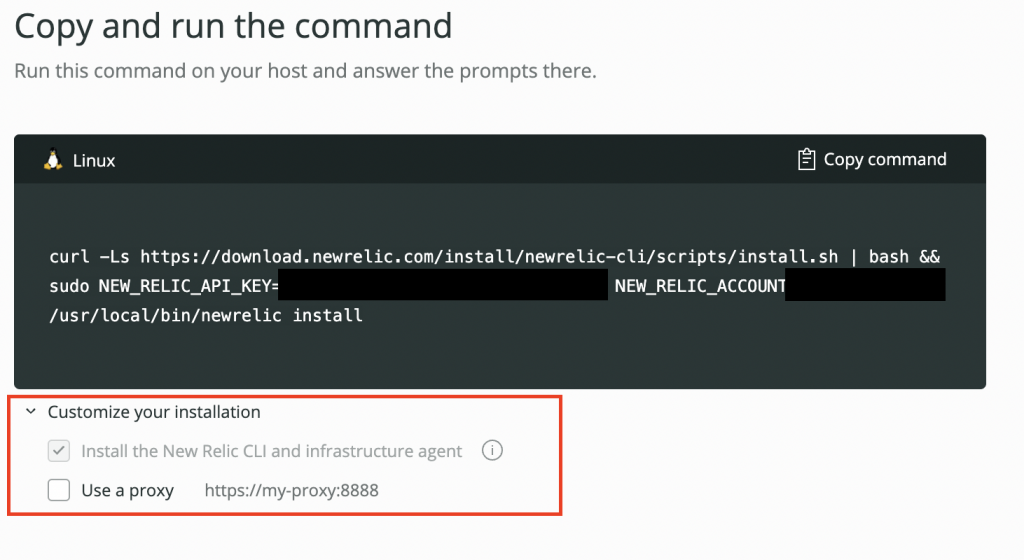
Login to your server and run this command. Make sure that you have the necessary permissions to the user for executing this. During the command execution, New Relic will be able to auto-identify the services that are running in the server ( like Nginx, Java, etc ) and recommend any specific agents to install. You can choose to skip and only use the core infra agent ( for the host ).
Note that you will be notified of any connectivity issues between your server and New Relic services during installation. You may need to open the ports specified for communication between New Relic agent and your server.
Monitoring the host stats in New Relic
Once the connectivity is established, you could refresh the “New Relic One” and go to the “Explorer” item. You should be able to see your host reporting the vital stats there. Note that by default, the new relic agent will take the hostname of the server for identification of the host.
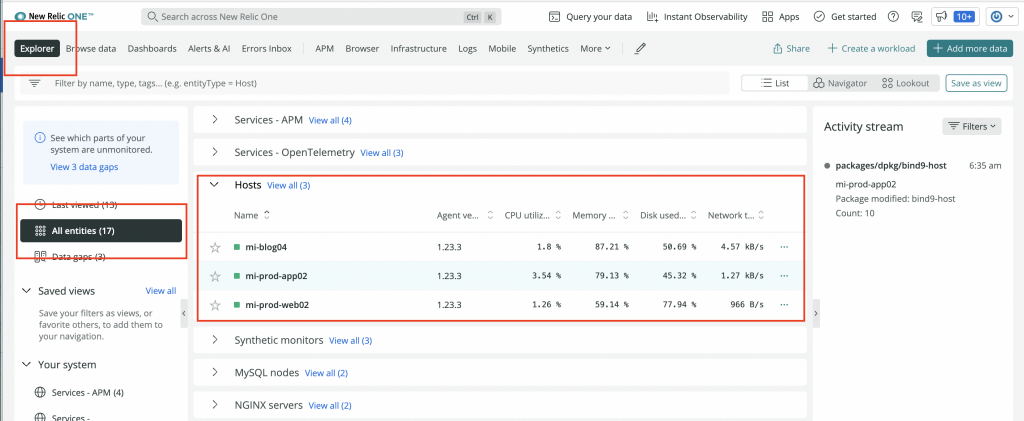
You can click on the hostname it will show the detailed metrics and graphs related to the memory, CPU, etc.
Host system logs
When you enable the New Relic infra-agent, it will not only ship the stats but the system logs as well for auditing. You can see all the logs ( whether the application, system, or services ) on the Logs section.
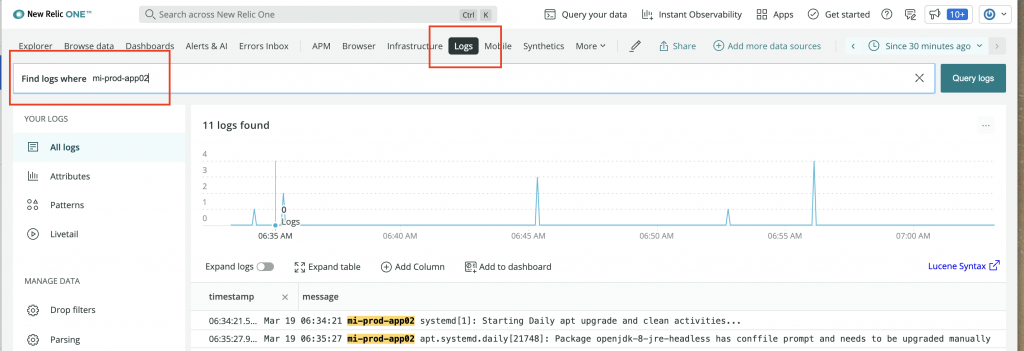
The logs section allows you to search using free text or on the fields reported. You could also save the query and the dashboard as well for later use.
NOTE: You can control the files that are getting posted to New Relic from your host system. Simply open /etc/newrelic-infra/logging.d/logging.yml file and you could remove or add entries as you wish.
Alerts & Notification channels
Alright, now we can see the metrics and see the current state of the hosts in our New Relic. But to make it meaningful and actionable, we need to make sure that we can set alert conditions and policies that generate alerts sent to the right team over various channels.
Golden Signals
New Relic has defined 5 key metrics as the Golden Signals for a service
- CPU Usage
- Memory Usage
- Throughput
- Response time
- Error percentage
By default when you set up the account, these are pre-configured in your system and can be customized.
Configuring/viewing alert conditions ( policies )
The alert conditions are configured under the “Alerts / AI” section of the New Relic One platform.

Go to the “Alert conditions ( Policies ) ” on the left side pane and you will be able to see the conditions configured for the Golden Signals. You could edit them or add new policies as you see fit.
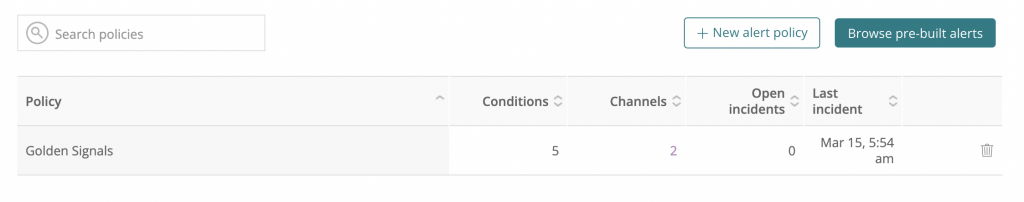
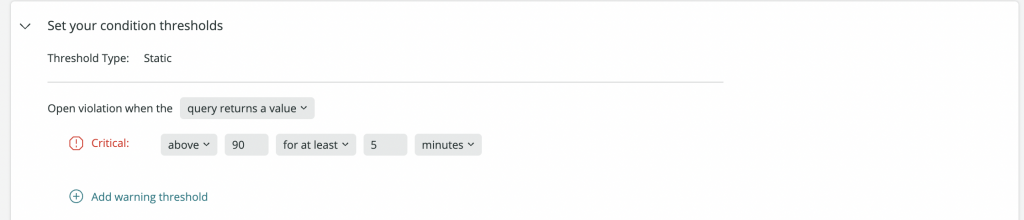
Click on the Golden Signals and then click on the one you want to edit ( like high-mem-usage ). You can update the threshold values or add warning levels.
Alert notification channels
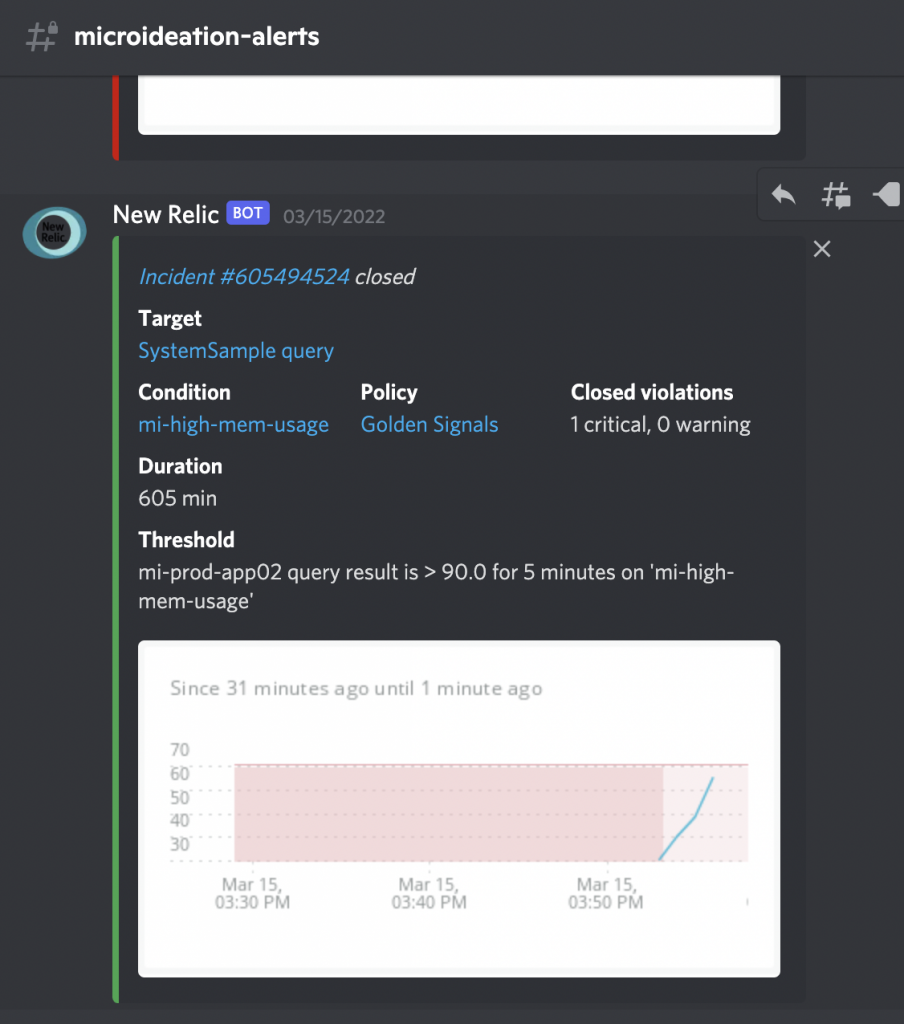
When an Alert is generated, by default New Relic would report it to your registered email. But there are other channels that you could configure in New Relic ( eg Slack, Discord ( free ), PagerDuty, webhooks, etc ).
When you are on the “Alerts / AI page”, you can scroll to the bottom of the left pane and click “Channels”. This will open the currently configured channels as below:
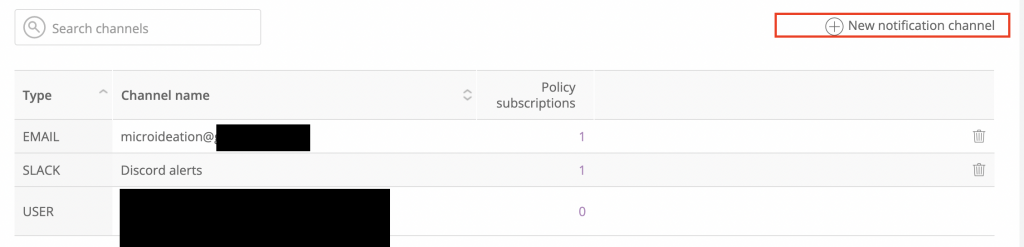
You can add a new one by clicking “New Notification Channel” and choosing the provider.
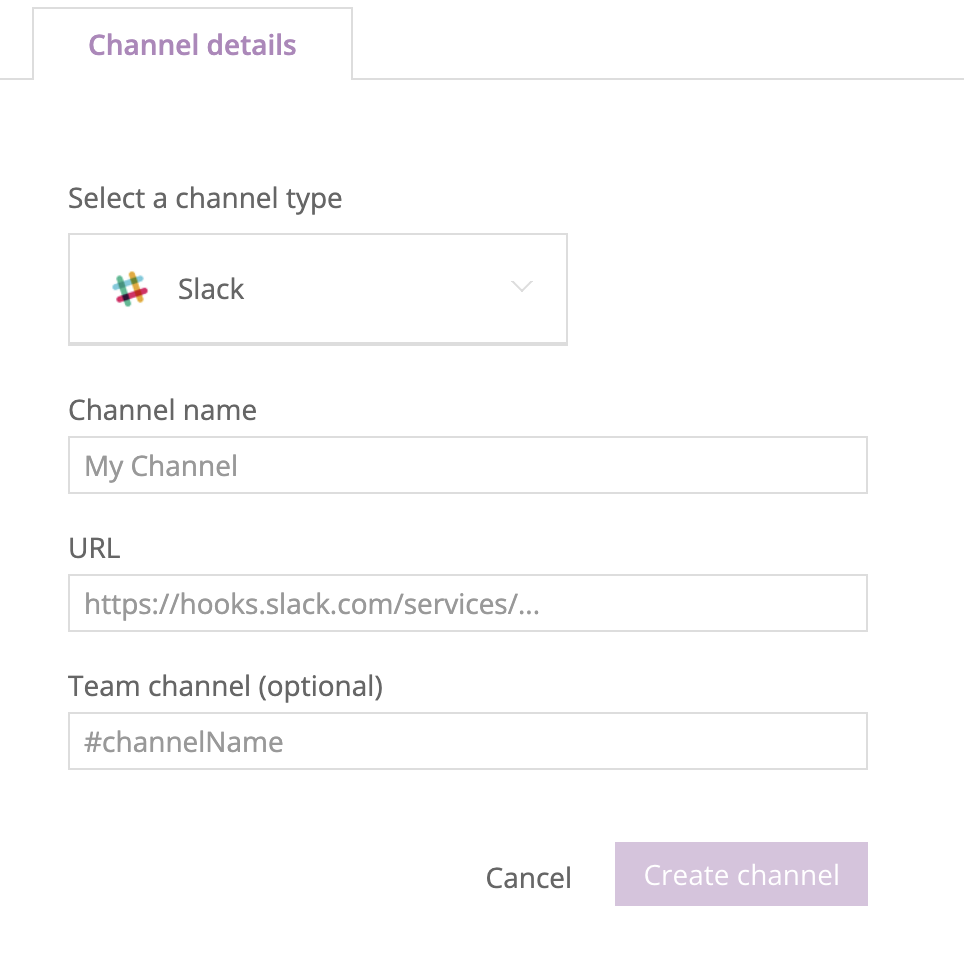
Note: The Discord channel I am using is not directly supported by New Relic, but can be done with some tweaks. I will be explaining it in an upcoming post. This is very cost-effective in case you are using New Relic for a personal project ( like in my case ).
Pitfalls of using New Relic for APM
We can see that it’s absolutely simple to get New Relic up and running with our hosts and start capturing the vital metrics for generating alerts. But everything has a downside as well and let’s discuss that as well.
Security of New Relic Agent
This is the single most concern when coming to exporting vital data from your services and systems to an external entity. New Relic is a SaaS platform and stores everything related to your server on their systems. This could be an issue when you are working on security-critical applications or the financial domain with enterprises. Many documents explain the security of the agent we are installing and New Relic is taking security seriously. You could read about it more here.
Data transfer costs
If you choose to transfer the data to New Relic, it’s egress from your server ( in the cloud ) to the internet and it will be counted against the data transfer. So this could end up as an additional cost.
External platform dependency for Alerts
You are required to completely rely on the New Relic infra for the alerts and error reporting. Even though New Relic is completely resilient, you are required to have some fail-safe alerts on your side in case New Relic completely goes off for some reason. But then again, that could be the same case with “PagerDuty” as well.
Foot notes
I am currently using New Relic in my personal project for monitoring the entire stack
I strongly recommend getting started with New Relic for your projects as the free tier is absolutely free with reasonable and generous limits. I will be deep-diving into the following topics in the upcoming blogs.
- Discord as free alternative to Slack for alert reporting.
- Nginx and MySQL service reporting.
- Custom log reporting for applications ( Open Telemetry ).
- Synthetic alerts ( Checking availability of a website and throughput ).
- Java application performance monitoring.
Let me know if you have any queries or need some assistance with some setup.