SonarQube – Part 2: Running analysis, configuring Jacoco for test coverage, Addressing the reported issues
In the last post, we have seen how to set up the SonarQube for a development system using a local git repository. We have also set up a project and are ready to run the analysis.
If you have not seen the first part, please check SonarQube: Part 1 ( Introduction, Setup using Postgres, Project configuration )
In this post, we are going to see how to configure Jacoco on your project ( maven ) for reporting code coverage by test cases, executing the sonar goal, and analyzing and addressing the issues reported by SonarQube for a better quality rank.
Configure Jacoco for Code coverage
We could run the sonar maven goal when the project is set up. But if you don’t have the Jacoco plugin setup in maven, the generated analysis report will not contain code coverage by the test cases. So for getting a more comprehensive report, we need to ensure that we put the below content on the plugin section of the maven project pom.xml file.
Jacoco plugin
For configuring the Jacoco plugin in the project, we need to make the below changes to the sections
Properties section
Add the below properties to the properties section of the maven
<properties>
    <jacoco.version>0.8.6</jacoco.version>
    <sonar.java.coveragePlugin>jacoco</sonar.java.coveragePlugin>
    <sonar.dynamicAnalysis>reuseReports</sonar.dynamicAnalysis>
    <sonar.jacoco.reportPath>${project.basedir}/../target/jacoco.exec</sonar.jacoco.reportPath>
    <sonar.language>java</sonar.language>
</properties>
Add the dependency for Jacoco
<dependencies>
    <dependency>
        <groupId>org.jacoco</groupId>
        <artifactId>jacoco-maven-plugin</artifactId>
        <version>0.8.6</version>
    </dependency>
</dependencies>
Maven Plugin Configuration
Finally, add the below plugin to the plugins section of the pom.xml file.
<plugins>
    <plugin>
        <groupId>org.jacoco</groupId>
        <artifactId>jacoco-maven-plugin</artifactId>
        <version>${jacoco.version}</version>
        <executions>
            <execution>
                <id>jacoco-initialize</id>
                <goals>
                    <goal>prepare-agent</goal>
                </goals>
            </execution>
            <execution>
                <id>jacoco-site</id>
                <phase>package</phase>
                <goals>
                    <goal>report</goal>
                </goals>
            </execution>
        </executions>
    </plugin>
</plugins>
Now we are ready to report the code coverage information to the SonarQubue.
IMPORTANT NOTE
If maven has got below plugin configuration for skipping the tests, then Jacoco will not report code coverage for test cases.
<plugin>
    <artifactId>maven-surefire-plugin</artifactId>
    <configuration>
        <!-- This will prevent Jacoco from reporting coverage -->
        <skipTests>true</skipTests>
    </configuration>
</plugin>
Running Analysis
Now that we have got all the necessary configurations done, let’s run the analysis. Open the terminal, go to the project folder.
As specified in the previous part, make sure of the following
- Project need to be setup properly using respective build tool ( Maven or gradle ) .
mvn( orgradle) is available in the path.- Make sure that project ( and its modules ) are all compiling successfully.
- All the test cases should be passed for the analysis to complete.
Execute the command that you copied from the SonarQube for running ( based on your respective build system )
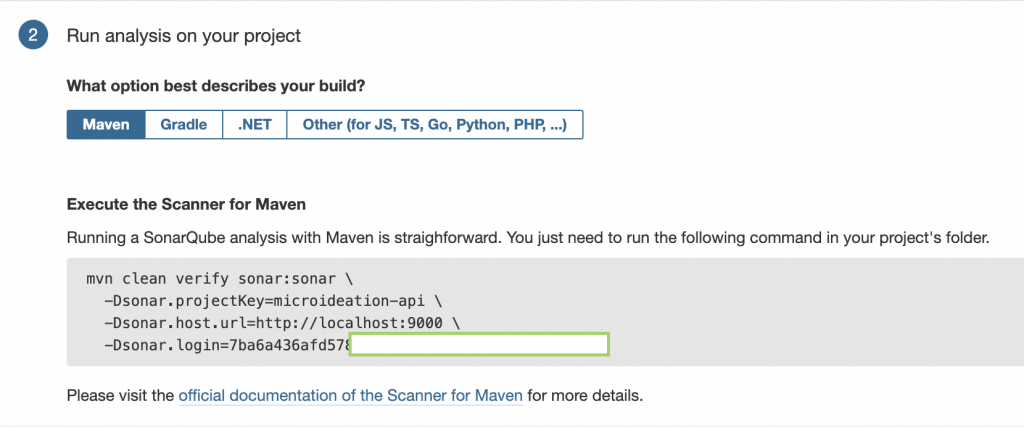
Wait for the command to complete. It may take several minutes based on the size of your project, the number of modules, and the test cases.
If there are any test cases that failed or any modules have compilation errors, the process may fail. You may need to execute the same again after fixing the reported issue.
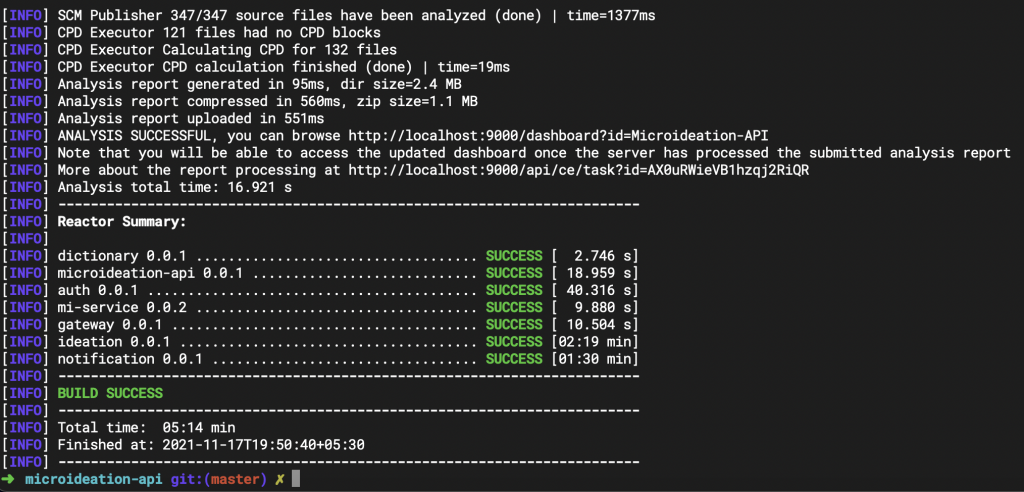
Once completed, you will see a summary on the terminal like something below:
Similarly, when you go to the SonarQube home page, you will be able to see the analysis report for the project that we just ran.
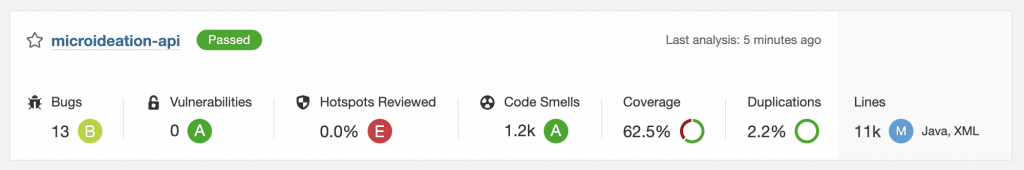
You can see the general information that the analysis has Passed the overall quality checks and is ready for production. There are also categories of analysis which we will see in details on the below section.
Analyzing the report
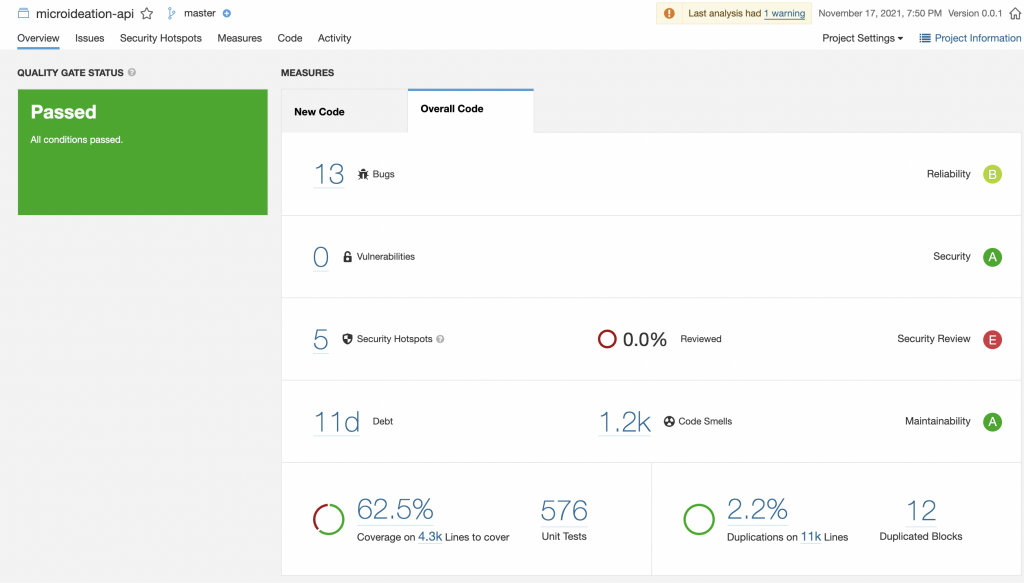
We can click on the project name and it will display the details dashboard ( something like below ) :
Report sections
Let’s go over each of the sections in detail.
Overall Status
This is displayed on the left side and shows whether the project has passed the quality gate. If it’s Passed, then the project is ready for production. Else, there are critical items that need to be addressed before we could ship it.
Bugs
The Bugs section will show the bugs that the analysis has identified in the code. These are actually potential issues and may not be 100% correct on your context. Clicking on the Bugs section will expand and display the details.
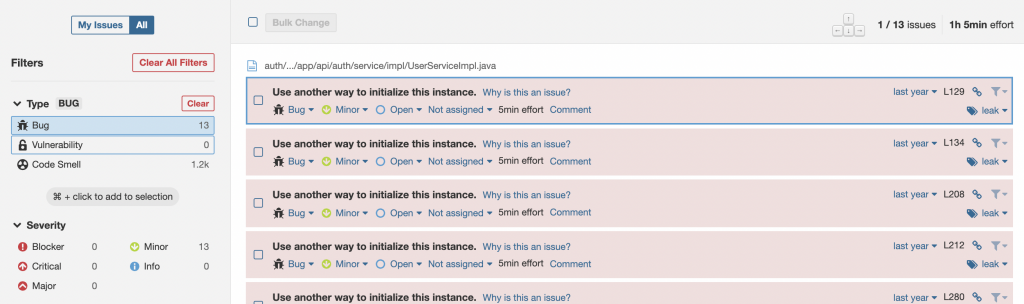
On the left side, you will be able to see the categories of the bugs based on the severity and the number of issues in each. The objective should be to reduce the Blocker,Critical and Major bugs.
The individual bugs of each severity can be viewed by clicking on the severity. This will list the bugs on the right side. You can click on the bug to see the details of where it is reported and also why it is an issue and how to fix it. This exercise will provide a wealth of knowledge and deep understanding of the language and the best practices.
Vulnerabilities
The next section will show the vulnerabilities based on the security audit ( OWASP or similar ). Similar to the bugs, we should be able to see the severity-based bugs and also the details on how to handle them.
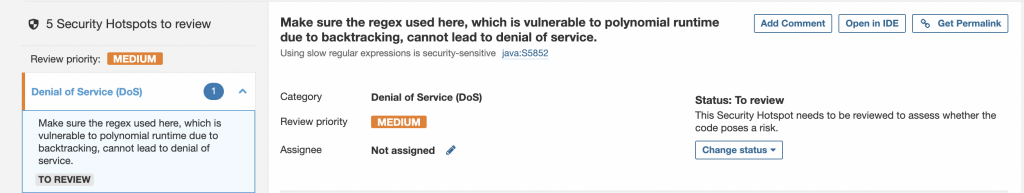
Security hotspots
These are issues or code presence that could lead to a common attack exploit. This may include false positives and you could mark them as not at risk by clicking on Change status and giving the appropriate details.
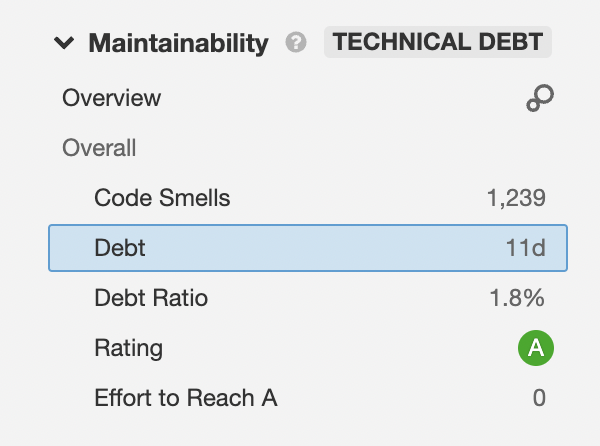
Technical Debt
This indicates the amount of work that we need to do for correcting the issues and findings reported by SonarQube. The lower the better.
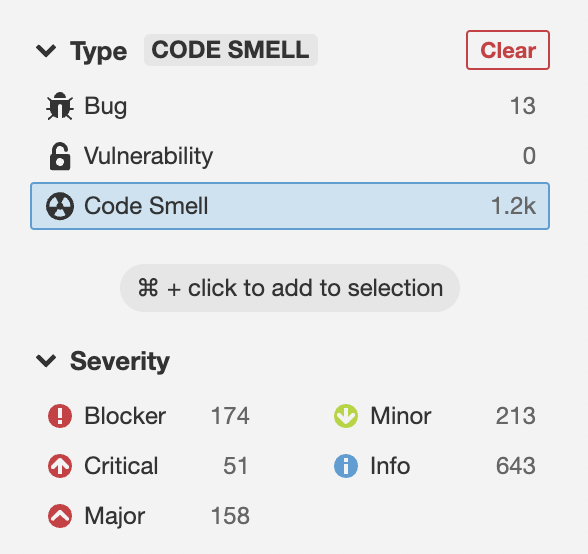
Code Smells
Code smells are deviations from standard best practices. This does not indicate a bug or a security vulnerability. These are mostly about code clean-up and following standards.
Code Coverage
The code coverage indicates the amount of code covered by the test cases. This includes the conditions, branching, etc in the code. You can view the details of the code coverage by clicking on the Code coverage field.
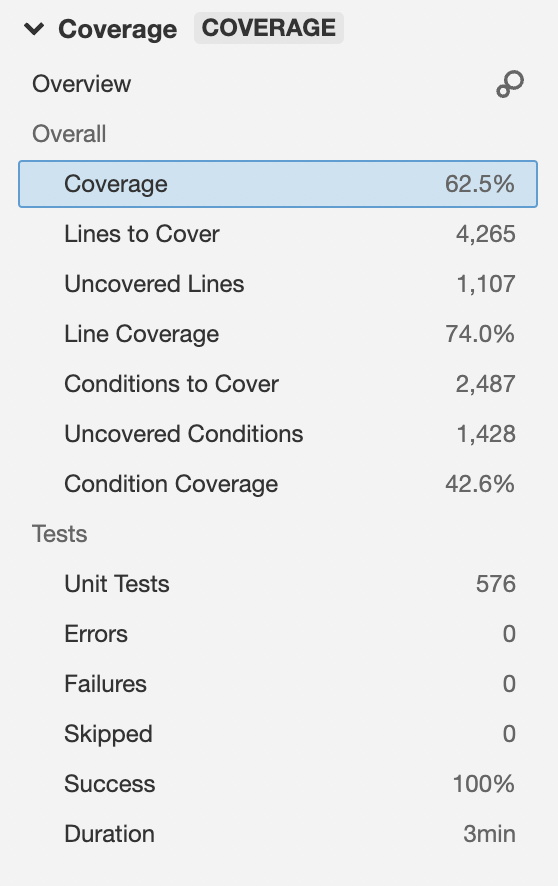
Some of the files reported may not be relevant to be covered by test cases ( like configs or repo calls ). But the objective should be to get coverage above 80%.
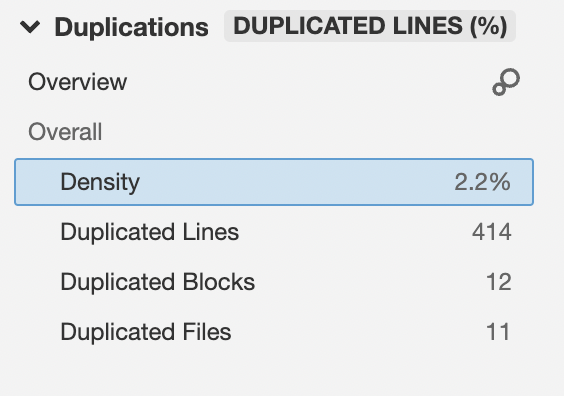
Duplication
This indicates the code that has been duplicated in the project ( the code that could be refactored )
Fixing the findings
While on the main project dashboard, when you move the mouse over each reported metrics rating, you could find what is needed to have the rating improved.
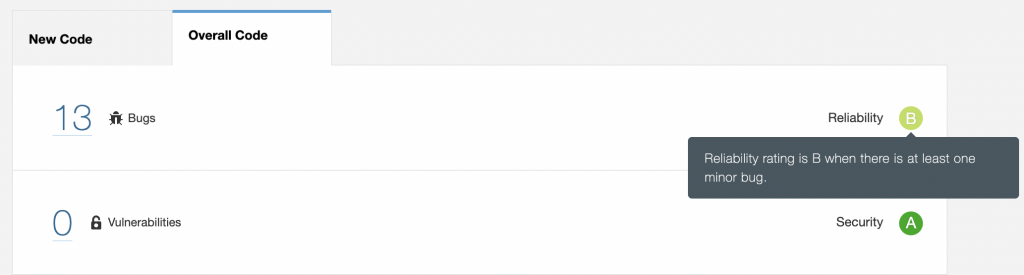
You can see that for the Bugs, the rating will be B if there is even a single minor bug. If there is at least one major bug, the rating will be C, and so on. Similarly, we could mouse over on each metric and find ways to improve the rating.
The Bugs and Vulnerabilities are the most important metrics and need to be prioritized first for fixing. As specified in the above sections, you go to the respective issues reported and SonarQube itself will show the issue and what needs to be done for fixing it. If the issue reported is a false positive, we could close the same with comments.
Once the issues are fixed, you can re-run the command for analysis ( maven goal ) and it will update the rating based on the fix.
More configuration
SonarQube has preconfigured the rules and quality settings for each language and setup. These rules and quality gates can be re-configured for our own liking and adjust.
For checking the profiles, we need to go to Project Settings -> Quality profiles or Quality Gate
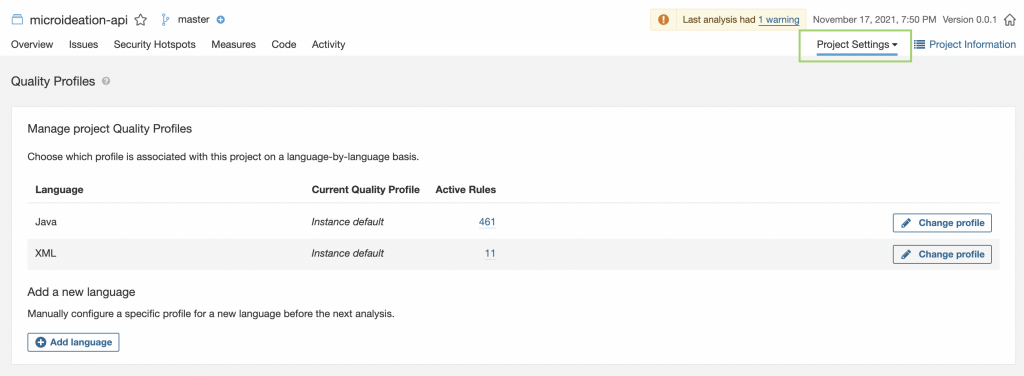
You can change the profile, relax or tighten the validations and requirements, etc.
There are other options also for controlling the permissions, tokens, webhooks, etc that we can use for controlling the project.
Conculsion
We have seen how to set up SonarQube and configure a local project quickly to run enterprise-grade code analysis. In its basic form itself, you will be able to get a lot of insights about your code and also identify major vulnerabilities.
The beauty of SonarQube is not in just identifying the issues. Its the way it provides the reason for the issue and the methods of fixing them. There will be a lot of things that you could learn as a developer from a single analysis ( best practices, issues, etc ).
We have only scratched the surface of SonarQube on a simple local setup. The real power is when you configure it to autorun the analysis by connecting to a version control system ( Github etc ) and then have it auto-tag the programmer on the issues identified in the pull request. We will cover more ground on them in a future post.
Let me know your queries and comments.


1 Response
[…] We will conclude this post at this point. We will be covering the following items in part 2. […]