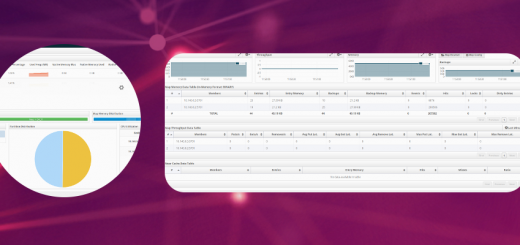
Setting up ELK Stack for near real-time log monitoring in AWS
ELK is a software stack that can help us combine all the logs from different systems and then analyze , monitor and evaluate in a single dashboard. The ‘ELK’ is an acronym made with the first letters of the components in it. Those are ‘Elasticsearch’,’Logstash’ and Kibana.
I have already written a different post on setting up ELK in a windows environment. I have done the same in servers running Centos hosted in AWS with latest versions of each component.
Setup
I have the following setup in AWS:
- 2 application servers
- 1 server dedicated for ELK monitoring
Our objective is to have the logs from both the application servers to be shipped to the ELK server and then analyze and generate dashboards in near real-time mode.
Installation
Download and install the latest version of the following components from the links below
- Extract all the zip files to a folder /opt/elk. Need to make sure that no additional folder is created under the main folder.
- JAVA_HOME need to be setup in the environment variable for logstash to run.
Configuration
We need to configure the individual components and start them. The setup and configuration for ELK is explained below. Login using SSH into the AWS server that you have chosen to run ELK stack.
Configure and start Elasticsearch
- Start elasticsearch by going to /opt/elk/elasticsearch-2.3.2/bin/
> nohup ./elasticsearch &
nohup will make sure that the process is not end when the SSH session is logout or exit - Try wget http://localhost:9200 and this should download a index.html file
Configure and start Logstash
- Add the logstash.conf file to logstash-2.3.2/bin folder
- Create a folder patterns inside the bin folder
- Copy custompatterns file to logstash/bin/patterns
This file contains the custom pattern for parsing a java class used in the grok pattern of logstash.conf file I am using. If you don’t have any custom patterns , you can skip these steps. I am specifying the custom patterns location in my grok block.
- Start logstash by running following command from bin
> nohup ./logstash.sh agent -f logstash.conf &I have created a customer logstash.conf file for the logback logs of java application. You can find it here. You can use any grok pattern to filter the source log file you are having. - If there are no indicies created under elasticsearch-2.3.2/data/elasticsearch/node/0/indices, the file may not be getting processed ( even after waiting for sometime). For troubleshooting we may need to set the input to stdin and output to stdout ( refer to logstash conf setup)
- If we want to completely reset logstash and read from start, we need to use the following config in the input section
start_position => “beginning”
sincedb_path => “/dev/null”This need to be reset to normal after the first read is done
Configure and start Kibana
- Start kibana from /opt/elk/kibana/bin/ and run
> nohup ./kibana & - Try wget http://localhost:5601This should save the index.html file
- We need to expose 5601 in firewall and AWS inbound
- For firewall
firewall-cmd –permanent –add-port=5601/tcp
firewall-cmd –reload - AWS inbound can be done from the security group inbound rules.
- goto the http://yourserver:5601 and it will ask for a initial setup and ask to choose the pattern for the indices to load
- By default the pattern is logstash-*

- Select the time-field as @timestamp
- In the logstash.conf file, we are configuring the time field in the log file to the timestamp field, else the @timestamp field in the kibana will correspond to the time when the log was added to the elasticsearch and not the timestamp of the log file.
This is done in the date{} construct of the logstash.conf file.
Moving logs to ELK server
Now that we have the ELK server up and running, we could have the logs moved to the location specified in the logstash.conf file and logstash will ship the logs to elasticsearch.
We can achieve this by doing SCP (Secure copy ) of files from application servers to the ELK server path. Please see my post on how to setup SCP between two servers in AWS. I have created a script that would copy the file with a date suffix to the destination.
- Setup the SCP between the application server and ELK server
- Create the script to copy the log file to ELK server. I have set the file to be suffixed with date and copy every 5 minutes and overwrites the content in destination. logstash is smart enough to identify where it last left out and add only the new content. In this way we will get a near realtime dashboard
You can download my script here. - Create a cron job on the application server to call scp as :
- Run crontab -e
- Enter the following content
*/5 * * * * /opt/scripts/pushlogs.sh > pushlogs.log - Save and exit
- confirm that the job is running every 5 minutes.
Final notes
Once you setup the ELK stack, you will be able to play with the data using kibana which provides built-in widgets and dashboard elements to create realtime dashboards. Some sample screen shots of what I have been able to create so far:


Please let me know your thoughts on this. I am planning to do a post of how to use the kibana widgets and will let you know when its done.
regards
S


3 Responses
[…] ELK stack for central logging […]
[…] ELK stack for central logging […]
[…] Setting up ELK Stack for near real-time log monitoring in AWS […]